Canvas
The Canvas is a built-in rich text editor that appears as a side panel during your chat. When the AI creates or edits a document, it opens in the Canvas — giving you a polished, formatted document that you can review, edit, and download.
What Is the Canvas?
Think of the Canvas as a mini document editor built right into the chat. Instead of receiving a plain text response that you'd need to copy and format elsewhere, the AI writes directly into a formatted document that you can work with immediately.
The Canvas is perfect for:
- Writing reports, emails, articles, or summaries
- Creating structured documents with headings, lists, and tables
- Generating charts and visualizations
- Iterating on content — asking the AI to revise, expand, or restructure
How to Use the Canvas
Creating a New Canvas Document
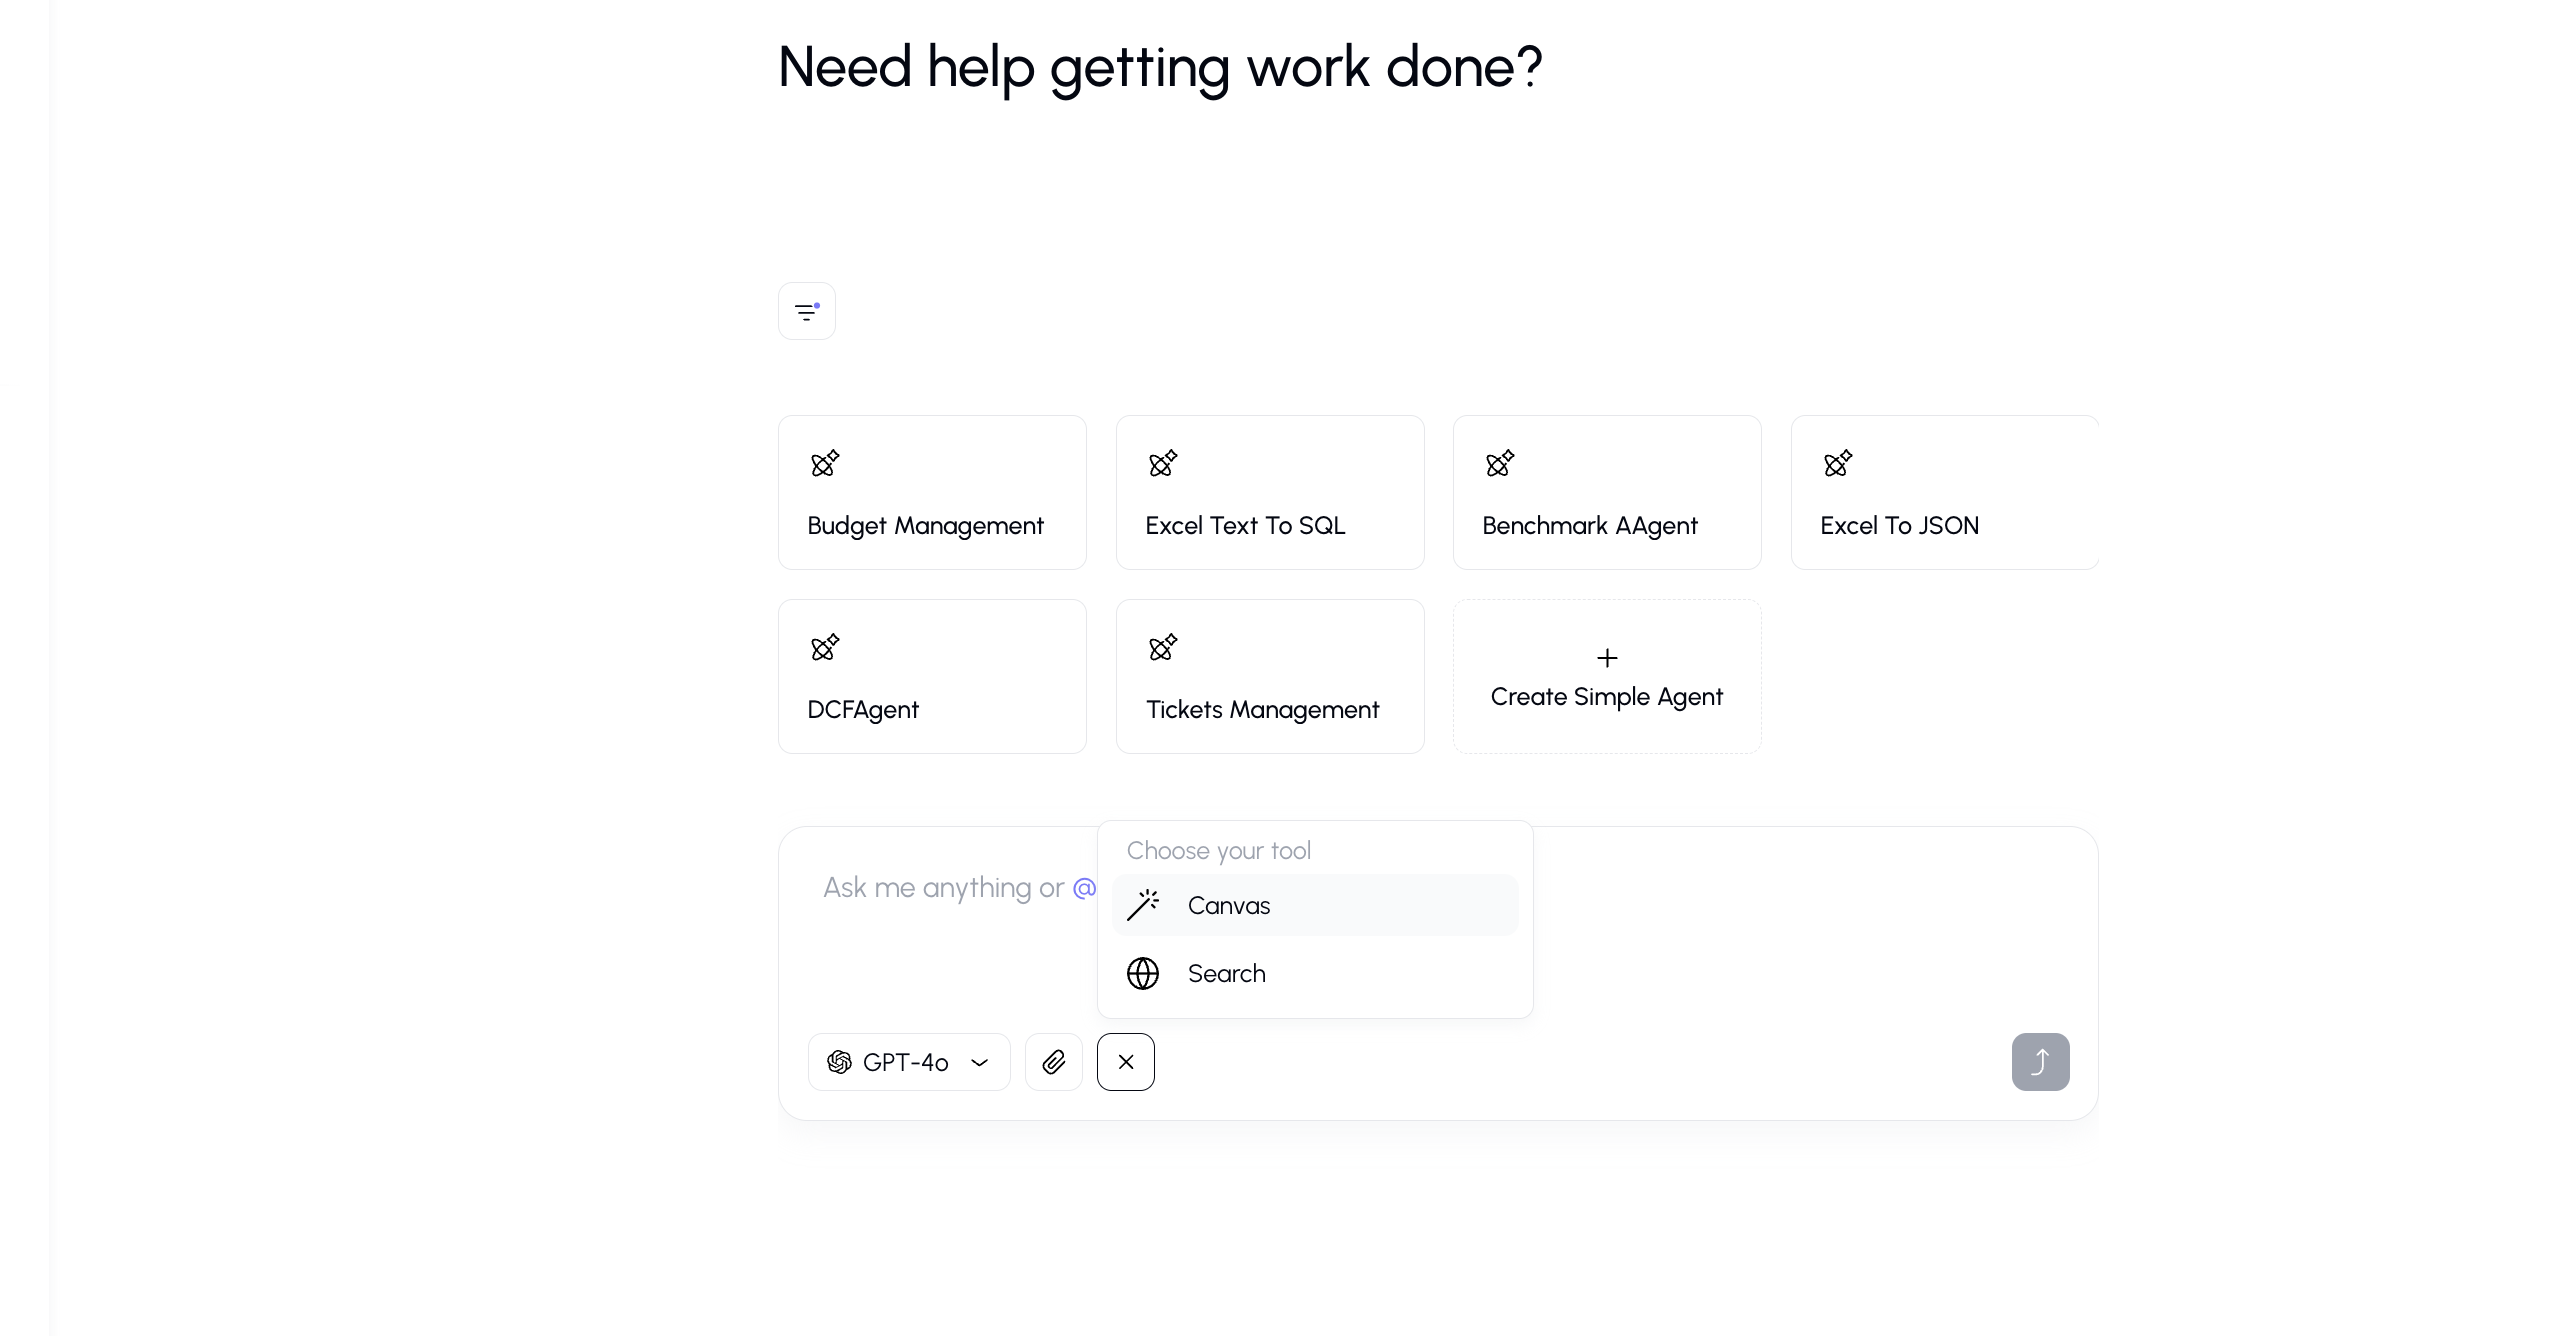
- Open the tools menu by clicking the "+" button in the input bar.
- Select Canvas from the tools list.
- Type your request — for example, "Write a project proposal for the new mobile app."
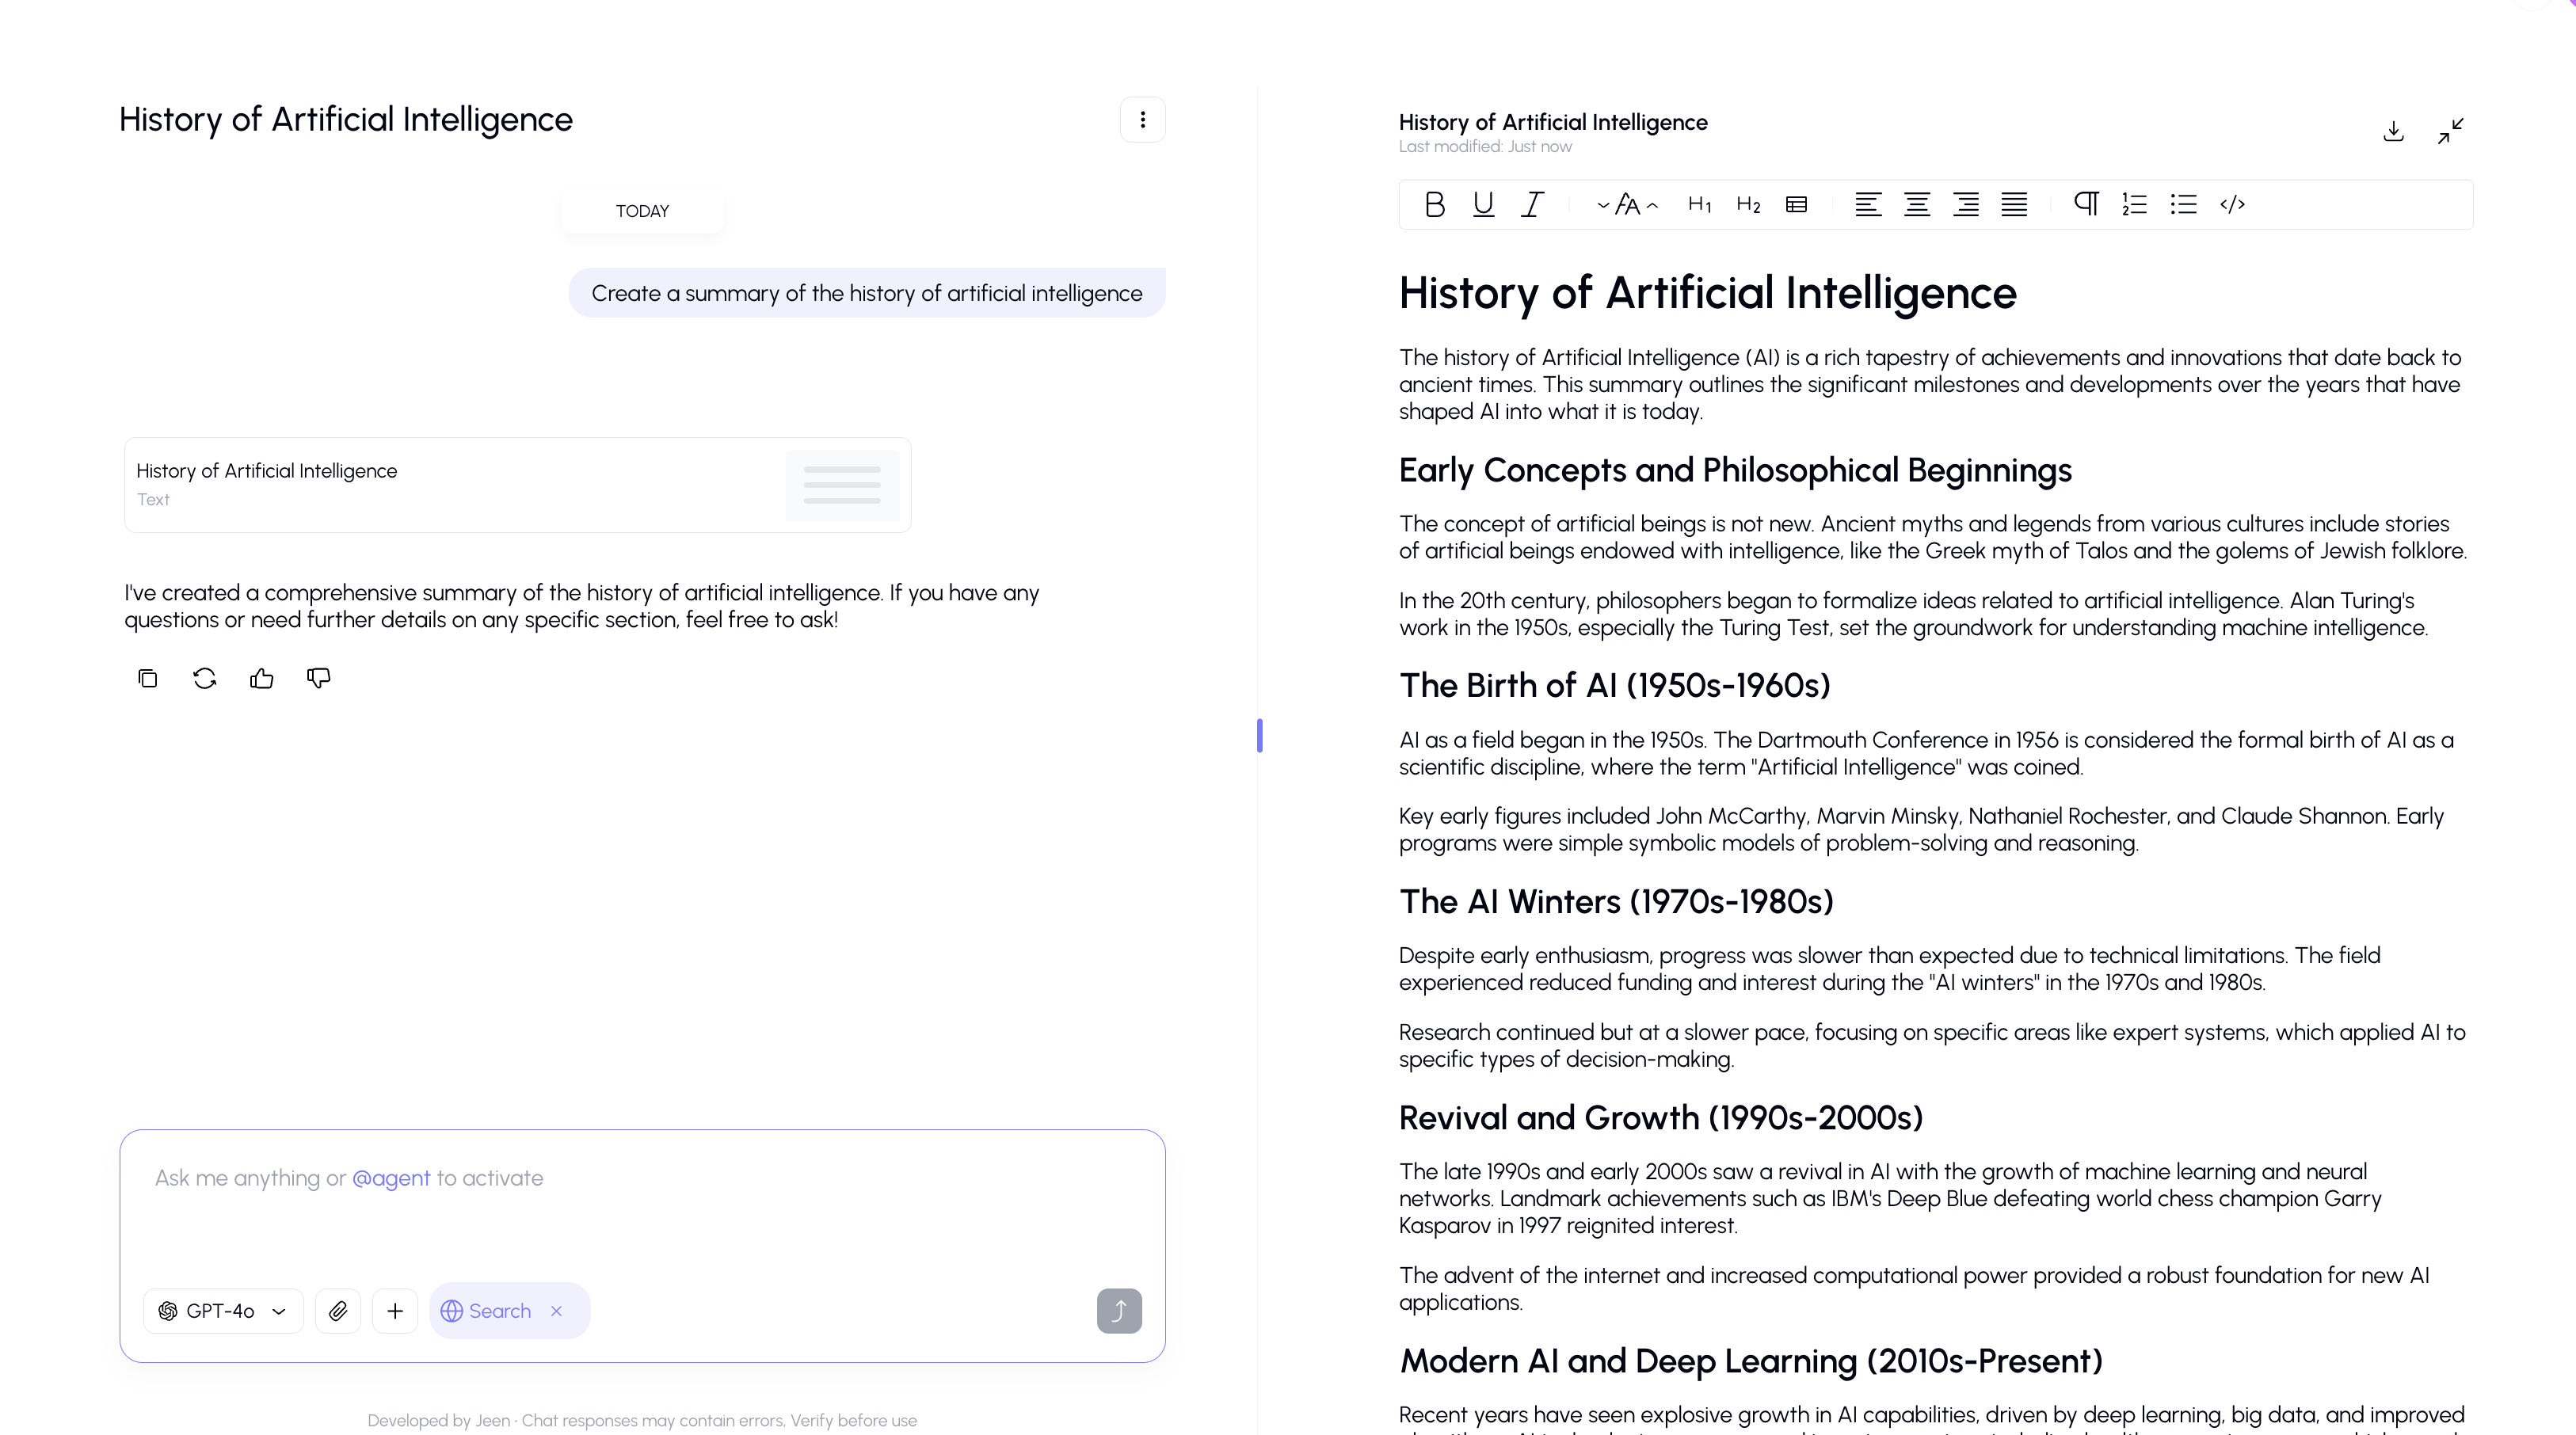
- The AI will create the document, and the Canvas panel will slide open on the right side of the screen.
- You'll see the content appear in real time as the AI writes it.
Updating an Existing Canvas Document
Once a Canvas document is open, you can ask the AI to modify it:
- "Add a section about the budget"
- "Rewrite the introduction to be more formal"
- "Create a table comparing the options"
The AI will update the document in the Canvas panel while you watch.
Canvas Editor Features
The Canvas includes a full-featured text editor with the following formatting options:
Text Formatting
| Feature | Description |
|---|---|
| Headings | H1 and H2 heading levels for document structure |
| Bold, Italic, Underline | Standard text styling |
| Text Alignment | Left, center, or right alignment |
| Highlight | Highlight text with multiple colors |
| Lists | Bullet points and numbered lists |
| Blockquotes | Indented quote blocks |
| Code Blocks | Formatted code sections |
Tables
The Canvas supports tables with headers, rows, and columns — great for comparisons, data summaries, and structured information.
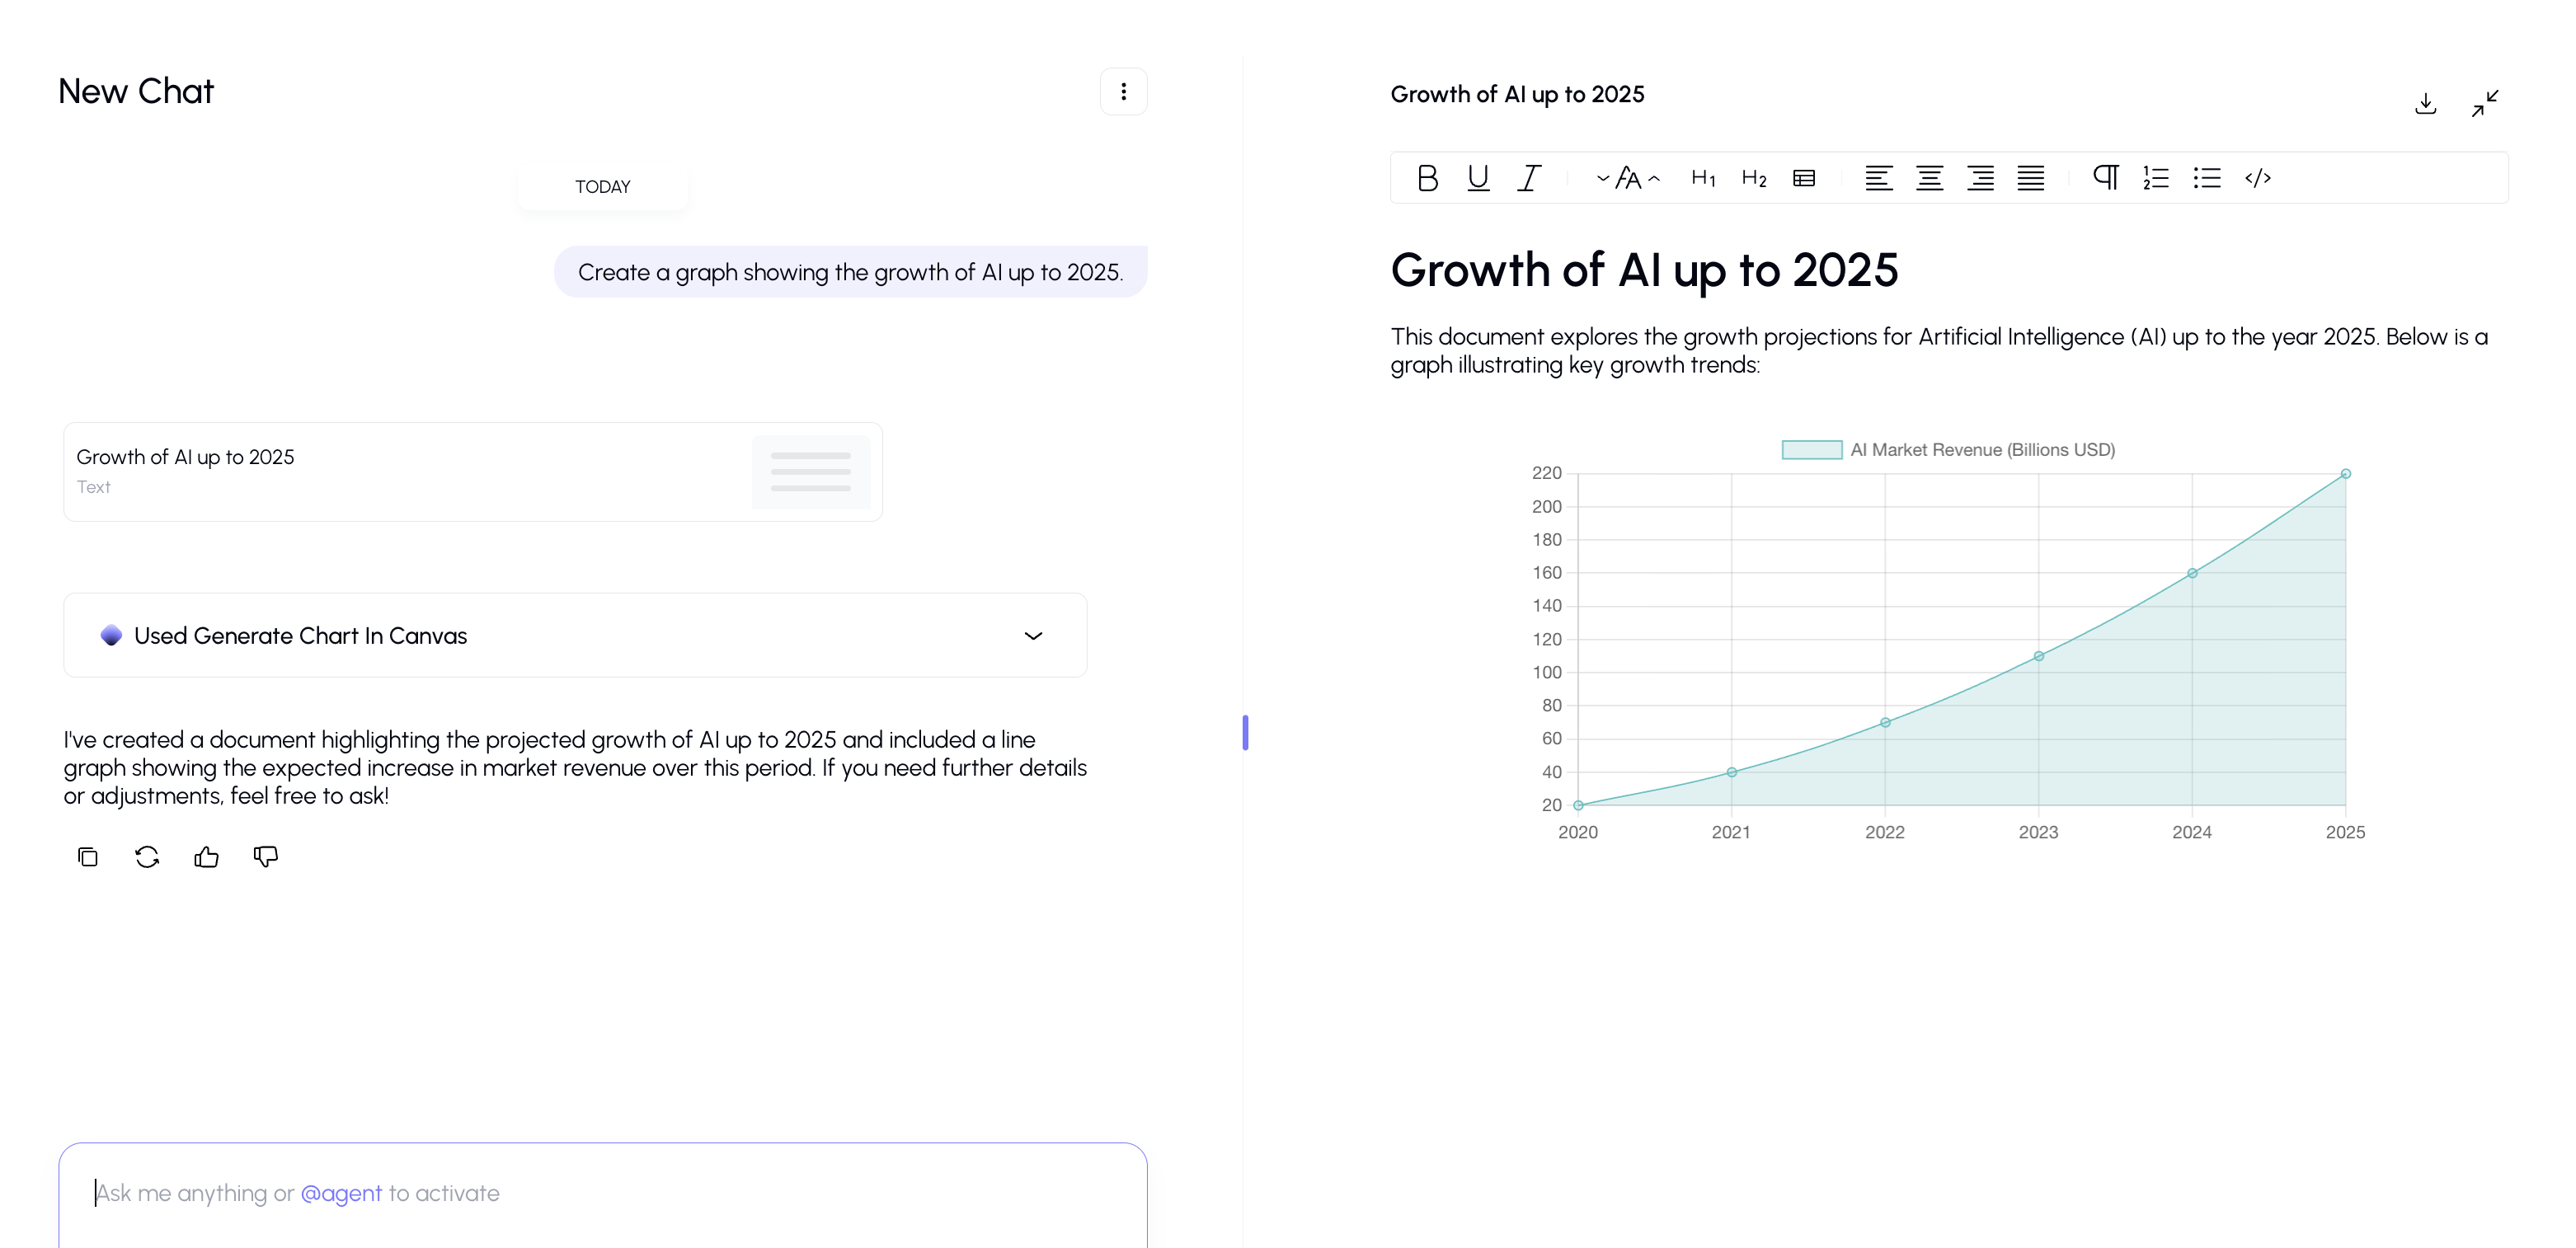
Charts
The Canvas can create data visualizations, including:
- Bar charts
- Line charts
- Pie charts
- Doughnut charts
- Radar charts
- Scatter plots
- And more
Text Direction
The editor supports both left-to-right (English) and right-to-left (Hebrew) text, switching automatically based on content.
Editing During and After AI Generation
- During generation: The document is read-only while the AI is actively writing. You'll see a streaming indicator.
- After generation: Once the AI finishes, the document becomes fully editable. You can make changes directly using the toolbar.
Tips
- The Canvas is great for collaborative writing — ask the AI to create a first draft, then refine it yourself or ask the AI for specific changes.
- If you need a chart, describe the data you want to visualize and the AI will create it in the Canvas.
- You can have the AI update only specific parts of a document without rewriting the whole thing — just be specific about what you want changed.
- Download finished documents to share them outside the platform.